


How to read the measurements?
Contents
We do think it would be a good idea to provide some guidance on how to read the measurements. There are quite a few of them and they play an important role in this test, since we are trying to establish a relationship between measuring and listening.

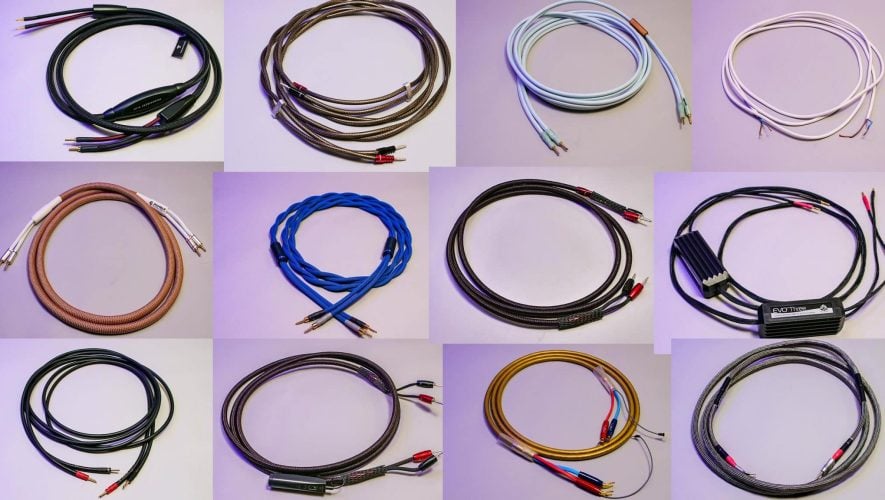
We measured a few properties of the cables
- Capacity
- Induction
- Impedance
- Resistance
- Conductance
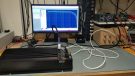
In addition, through the Prism and the Rigol scope, we measured the following:
- Shielding
- Response to a 20 kHz square wave
- Frequency response through a speaker and a dummy load (response to the speaker is shown at the end in the overview)
Capacity can be thought of as the “capacitor effect” of a cable. How much energy does it store? We talk about picofarads in many cases here, but the two ‘passively filtered cables’ go into nanofarads (factor 1000 higher). Those store much more energy through their circuits. Is that a bad thing? That’s the question. Many amplifiers are fairly immune to capacitance. But it might do something in theory.
Then there’s inductance. This is simply explained as the phenomenon of generating an electrical force in an alternating electromagnetic field. And that’s what we’re dealing with in a speaker cable, since alternating current is going across it. Also, you can partly think of it as a coil effect, just like in a speaker. In a speaker it functions as a low-pass filter. In a cable, that can also happen if the inductance gets too high. What is too high? Good question, because again it depends on the combination. You can assume that a cable with a high inductance value will have a high roll-off. How much roll-off, depends on several factors.
With impedance, we measure two things: impedance and phase shift. Impedance is a unit for a complex and frequency-dependent resistance. So it’s different from just resistance where purely the conductor is measured. We do that as well. And just like impedance, a lower value is better. With impedance, a graph of phase is also shown. This is because there is also frequency and time measured. The final phase rotation is also dependent on the inductance and capacitance, because they also have their effect on the impedance. You will see a realationship between those graphs.
The conductance is purely indicative. It shows how pure the material is that has been used. Ricable claims to use very pure, 7N copper. That matches up pretty well with what we measure on 2 x 3 meters (we go out (+) and back (-) in the cable in this measurement). Shunyata tops that with the very purest copper. And so that is visible in this measurement.
The square wave measurement speaks for itself: the more ‘angular’ and ‘square’ the better. Simple as that.
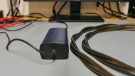
The measurement of the shielding also speaks reasonably for itself. Green is without the adapter switched on and red and with the switching power supply next to the cable. The less red, the better the shielding.
Finally, the frequency response. We have put all cables in one graph to give an idea of the differences in response. So you see purely the effect of the cable on the frequency response. The scale is a bit crazy (dBu), but we couldn’t get that changed easily. One box is about 0.5 dB difference. You can see very well here the overall effect of the cable on the frequency response. The most interesting thing is the effect on the speaker, because that is a dynamic load. So we have published those.
Check all measurements
All measurements are in our database. Here you will find a link to all test results. You can use these measurements – and the measurements in this article – for your own insight. We would very much appreciate it if you would not share the images directly with third parties (there is a lot of work involved). Your own use is of course fine. And you can always share the article :-). Thank you for understanding and cooperation.
Jammer genoeg, is het onmogelijk om naar een kabel te luisteren. Je luistert naar een bron, analoog of digitaal (hoorbare verschillen). Je luistert naar de kwaliteit van de opname (de verschillen kunnen enorm zijn), uiteraard een versterker (kunnen redelijk verschillend zijn).
Dan naar twee klappen op de vuurpijl. Als eerste, de gigantisch grote verschillen tussen diverse luidsprekers. En als tweede, de grote akoestische verschillen in diverse ruimtes.
Tot slot, wat zijn de kwalificaties van genoemde testers? Opleiding? Ervaring?
Wat weten we nu na deze test van Alpha Audio? Twee testpersonen vinden iets van een systeem met verschillende luidsprekerkabels. Niets meer en niet minder.
Met vriendelijke groet,
Wil van den Dungen
musicus
You replied to the English version of the article. There is a Dutch version as well. You can switch languages via the menu. Thank you.
Both commenters in that video are musicians….
A good old tweak is to mount a resistor equal to the characteristic impedance of the speaker cable across the speaker terminals to eliminate reflections if the speaker is not impedance linear.
Be aware that the sound may take on the flavor of the sound signature from the resistor used.
Hi Martijn
I don’t have the original AES paper, but here is a handy link to a Wireless World article: https://www.dadaelectronics.eu/uploads/downloads/05_Other-Quad-Documents/Quad-405-303-II-compared-1978-Wireless-World.pdf
There have been several other articles about this test. You can discover the names of the ‘golden ears’ who spent a full day listening.
Quad also used to carry out listening demonstrations of live accoustic music and recordings of the same. A curtain hid the source.
Thank you Richard.
I also think the use of psuedo-square waves is problematic! Fourier transform theory says that a square wave is made up of all the sinusoidal odd harmonics of the base frequency, up to infinite frequencies! But there is an odd mathematical effect – the combination of these sine waves produces an overshoot of about 9%. If the rise time of the wave is not instantaneous (and in practice it never can be) high frequency ringing artifacts are produced MATHEMATICALLY. A good music source for near square waves is a CD, but the rise time would be 1/44,000 th of a second. SuperAudio CDs or DSD files, which can only nudge the sound up one notch a few million times a second, cannot produce anything like square. Similarly, a vinyl record with a groove with a perpendicular right angle is un-trackable.
The speaker used is described as an average difficult speaker. This means that its impedance varies substantially with frequency – probably dropping in the cross-over regions which requires corresponding more current from the amplifier. In the good old days, it was standard practice for speaker tests to include graphs showing impedance again frequency. Add a purely resistive load (or cable) and the overall impedance curve flattens a bit, changing the relative loudness especially in those troublesome cross-over frequencies where more current is needed. This means that any cable changes the sound for any practical loudspeaker, and different cables (or cable lengths!) will change the sound differently.
The most thorough blind audio test I have read about pitted three types of amplifier (valve and solid state) made by Quad against each other. Each test played the same four studio-quality music tracks, and six experienced reviewers were asked whether A sounded better than B, or worse, or the same. Sometimes A and B were the same amplifier! Statistically, nobody could reliably tell the difference …
Can you make explicit what your message is? For me, there is an implicit message you are trying to make, but I fail to pick it out of your text.
The word ‘statistically’ is (ab)used incorrectly in a lot of cases. Just for illustration purposes: With a variable x=3 and the number of subjects n=6, you cannot speak of any form of statistical inference. The number of uncontrolled variables at play is even greater, so any form of conclusion is anecdotal.
As is our test, by the way. But we do not pretend or claim to have setup test conditions that would yield any statistical validated conclusion.
The feedback we got though is that no one has ever tried to do a test like this, so at least there is more information than there has ever been. And you can listen back.
But we encourage you to draw your own conclusion from this test, because we know there isn’t a definitive conclusion and much of it is down to personal preference in the end. We will never convince the skeptics, but that isn’t our goal. We just hope this will help to guide people in the purchasing decisions they want to make and to give some guidance in a world where hyperbole is the norm.
Thanks Martijn
I was trying to make three separate points.
1 – True square waves do not exist in nature or audio recording systems. IN MATHEMATICAL THEORY, when transformed into all their sinusoidal frequencies and summed to recreate the original square waveform, an overshoot of about 9% appears. Inconvenient but also present with real-life near-square waves together with ringing artefacts.
2 – Real-world speakers do not have the same impedance at all audio frequencies. Speakers may have 20 times as much impedance at some frequencies as at others.
Therefore adding any impedance in series, even a simple resistance, will change the current flow in different ways at different frequencies, which we hear as a tonal change. So any speaker cable will change the sonic character of any speaker. The change will depend on the impedance curve of the specific speaker and the preference of the listener. But a cable that may ‘improve’ one speaker is just as likely to ‘impair’ another.
3 – I gave an example of just how hard it is to reliably report on differences in listening tests. In this context, statistics is an exact science and answers the question “what is the probability that the observed results could have arisen by chance?”. The mathematics is based on the result being perturbed by a large number of uncontrolled variables! The perturbations are ‘averaged out’ by repeating the test – the more repetitions, the better.
The six listeners were presented with 96 A-B tests where A could have been any of three amplifiers, and B could have been any of the amplifiers including the one played in A! This is 9 possible combinations so each test was replicated about 10 times. Each listener only had to report better, worse or no preference.
I am sure you would agree that if any listener reliably got the same result for the same 10 tests, it would be highly significant. But in reality, no individual’s results differed significantly from pure chance. As a group, 68% of results showed no preference when the amplifiers were the same, but remarkably 64% also had no preference when the amplifiers were different. The scientific conclusion: the expert panel could not hear a difference between the valve and solid-state amplifiers under test.
Richard, do you have a link to that amplifier test setup and how they did conduct it? Would be great to read up in detail in what they did and how they arrived at conclusions.
Oops sorry they are speaker cables. My bad I was thinking of interconnects for some reason
Indeed… We are testing speaker cables… 🙂
Again thanks for sharing all that information.
Yes, please check the rise time of the waveform out. From the scope shot it looks like it could be quite fast. A cable system will begin to exhibit transmission line effects when its length is about 1/6 the “length” of the rising edge Thus my commentary. If I’m wrong on that edge speed, please forgive me.
Coax cable for example has a propagation velocity of about 66% the speed of light and a corresponding propagation delay of about 1.5 ns seconds per foot. So for example if you had a 10 ns rise time the electrical length of that in a coax cable would be 6.7′. 1/6 of that is 1 1′.
If your signal generator is capable of say a 50 MHz square wave, that signal rise time is also going to have to be much much smaller than the fundamental frequency of 50 MHz (Tp=20ns). Ie, it would be much much faster than 20ns..
And using 50 ohms output impedance from the generator would be a better match for most sources that are driving the cables. Eg, a preamp out. And also wondering why the load side is terminated in 4 ohms rather than say, 10K (these are not speaker cables).
From here I’m not sure about the shunyata waveform for example, but it could be related to the impedance it’s presenting in the MHz range. We would have to know some more about these things.
I do believe that you’ll find that, once you slow down the edge rate (if you can) to a more appropriate audio bandwidth rate you’ll probably see about perfect square waves on all of them.
You can check the link below for some more basic info. Take a look at the lumped vs. Distributed section for example:
https://practicalee.com/transmission-lines/
Ok. Interesting knowledge! I will look in to that.
Some very nice work here, thanks so much for sharing. Especially the listening comments. Very nicely done!
This is meant constructively. I’d like to point out the square wave testing here is misleading at best. The wave being used appears to have a very fast rise time (Mhz range edge speed). Thus this is high speed digital (at this cable length) and puts everything into the high speed digital cabling realm. Ie this is now a transmission line system operating well above the audio band. It’s no longer a lumped system where all we need is Ohm’s law.
T-line is a whole ‘nother advanced electrical ball game that not everyone is aware of. The scary looking overshoot and ringing are due to transmission line effects with mismatched source, load and cable impedance (at the edge speed), not the cable per se as in ~ audio band Ohms law. At this edge speed it’s all relative to the length, the cable impedance (at the high freq), the source and the load impedance.
In short if the cable, load and source impedances do not match properly there will be overshoot and ringing in any transmission line..
And load side, terminating the line with 4R does not match most transmission line cable impedance properly at that speed anyway. For example regular old coax, generally around 60-70R would match it properly. The boutique cables in this case will be all over the map as to what their MHz range impedance is.
At high speed definitely even the resistor used matters. A regular large load test R for example (or a cheap sand cast xover R) will have a MHz range impedance that is complex and not straightforward to match properly for example (not just 4R). Terminate instead for example with a small SMD R with short leads to the cable and the picture will likely change dramatically.
This also means your source termination has to match as well. Most high speed generators have a a 50 Ohm output impedance setting. This will also likely not match well with most of your setup.
The easy solution here for your testing would be- don’t be square wave testing this setup in the high speed digital realm. These interconnect are not for a high speed digital system. Instead, launch a square wave into the test setup that has a more relevant audio bandwidth edge speed (rise time setting). Your test will then also not show scary looking overshoot and ringing result, but it will at least show the true picture for audio.
Hi!
Thanks for your extensive comment. I have to look into the SQ-wave tests I used a 20 kHz square wave, generated by the Rigol function generator. I’ll look up the specs.
I have a question though… why do the Ricable and Shunyata transmit it perfectly? Also the transparent seems to be doing well. All cables are 3 meters… Input was terminated at 100 kOhm.
Best regards,
Jaap